2. Edit Individual Graphs
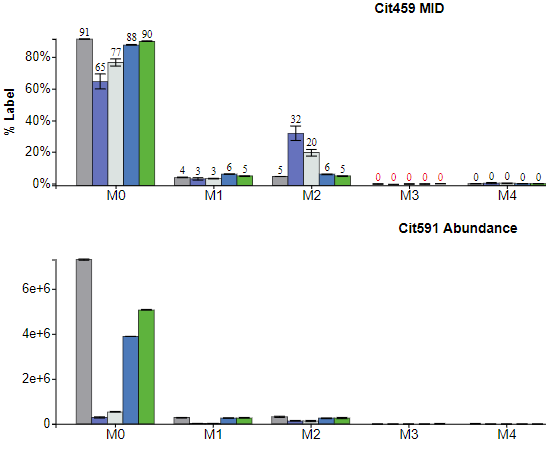
Individual graphs generated by Escher-Trace can be edited, downloaded, or used to access additional data associated with the graphed metabolite. Additionally, title and y-axis label text can be altered by clicking on either and typing the desired name. These processes apply to all Escher-Trace graphs, not just the ones shown below.
2.1 Access Additional Graph Options
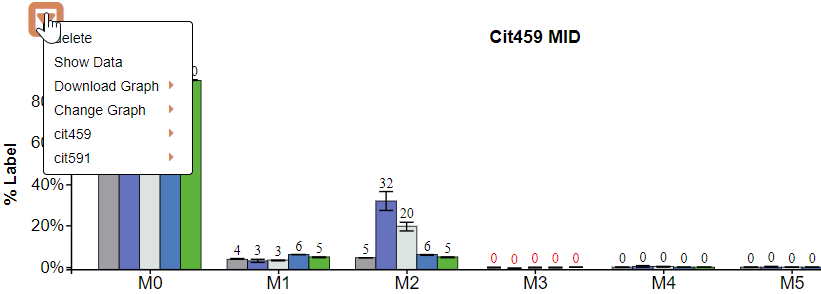
There are two methods to access additional options for individual graphs. These options include Delete, Show Data, Download, Change Graph, and multiple fragments of the individual metabolite if applicable. These operations apply only to the graph/metabolite that was selected.
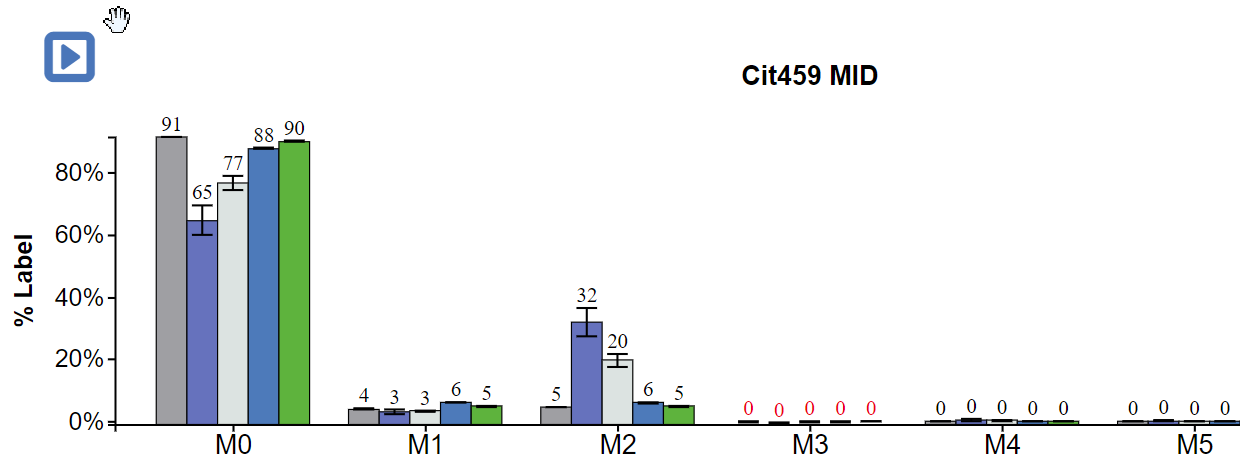
Method 1: Left click on the menu triangle located in the top left hand corner of all graphs
Before clicking menu triangle:
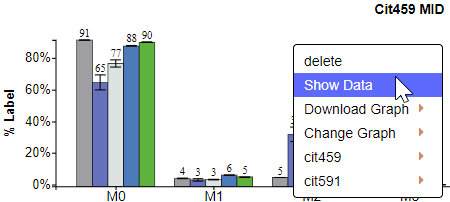
After clicking menu triangle:
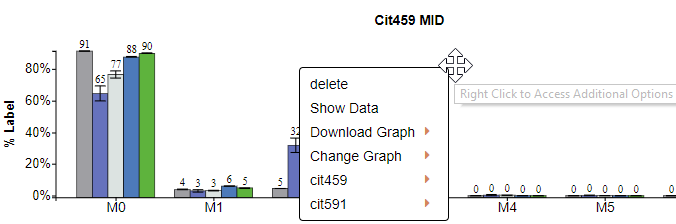
Method 2: Right click anywhere on a graph
After Right Clicking on a graph:
To get rid of the dropdown menu simply click away from the graph and menu.
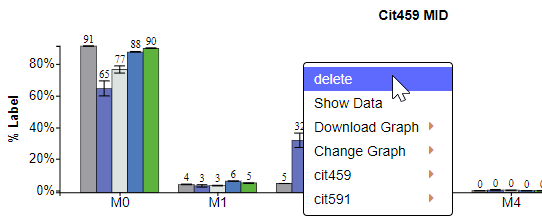
2.2 Delete Graph
To delete a graph, click on delete after making the dropdown menu appear.
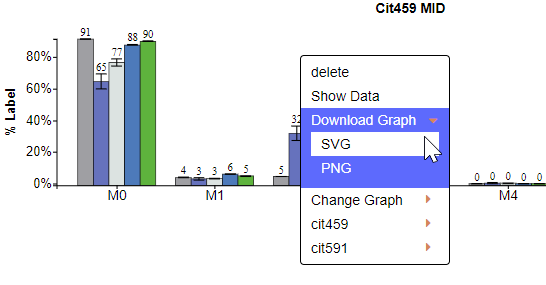
2.3 Downloading an Individual Graph
After making the dropdown menu appear click on Download then select the file type you want to download the graph as, either SVG or PNG.
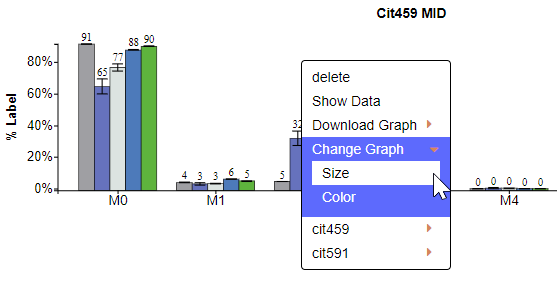
2.4 Change the Graph Aesthetics
After clicking on Change Graph additional options will appear allowing you to change the size and color scheme of the individual graph.
2.4.1 Change Graph Size
Click on Size to make the Graph Size pop-up appear.
Interact with the Graph Size pop-up as described here.
2.4.2 Change Graph Color Scheme
Click on Color to make the Color Scheme pop-up appear.
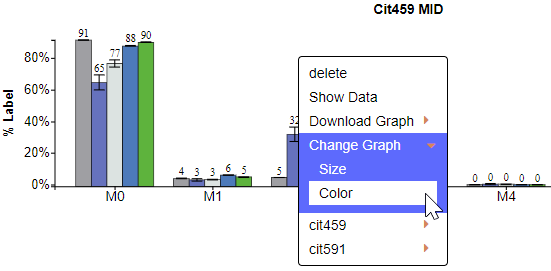
Interact with the Color Scheme pop-up as described here.
2.5 Access additional Graph Types for this Metabolite
The last option allows you to select a different graph type for specifically the selected metabolite. Simply click on the metabolite/fragment name then click the desired graph type and that graph will appear.
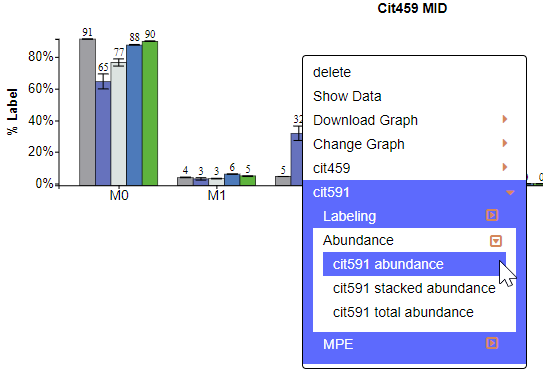
After Click:
2.6 Show Data
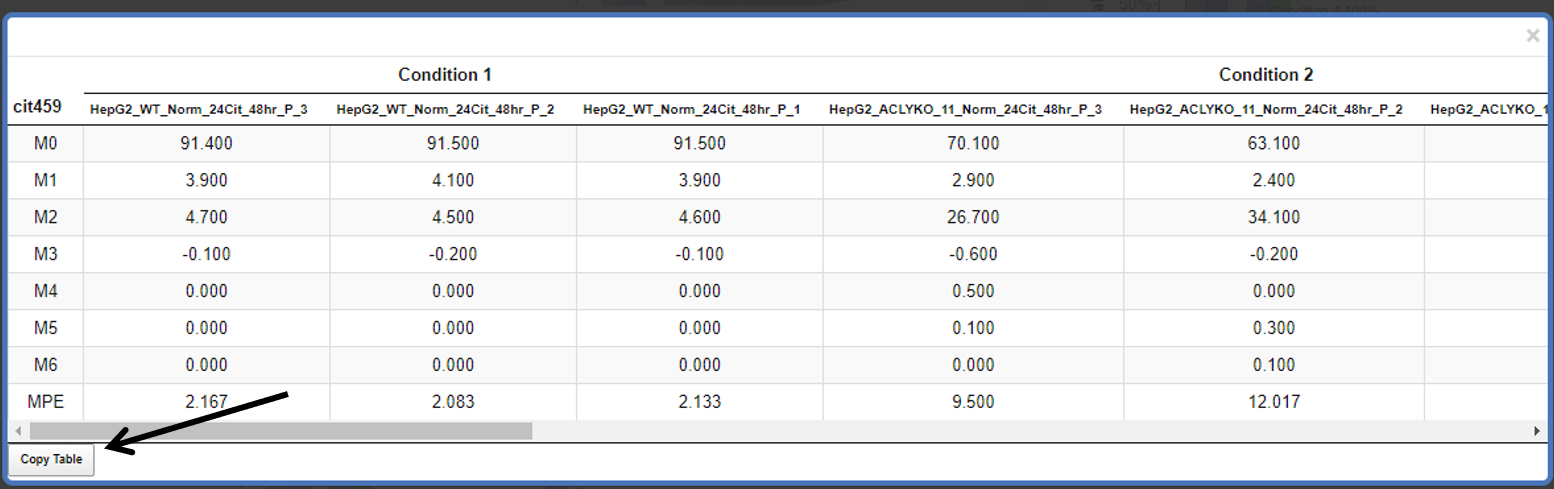
Click on Show Data to view the data used to generate the selected graph.
After Click:
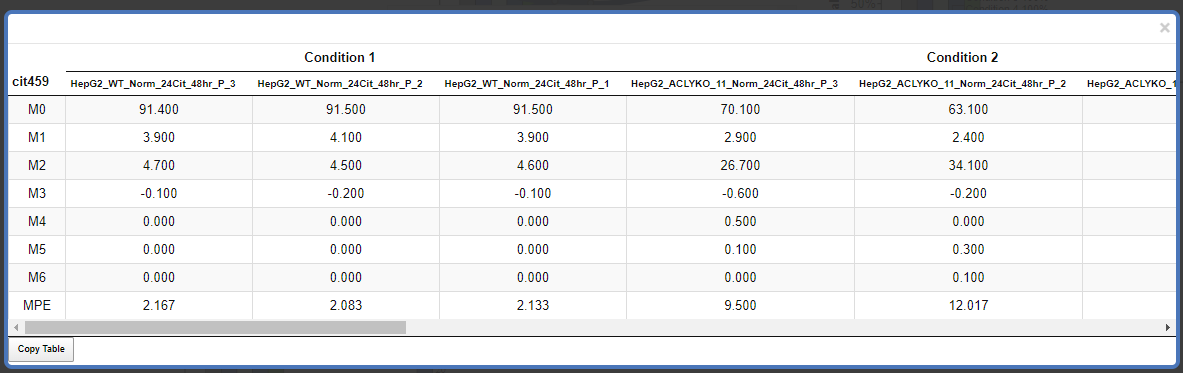
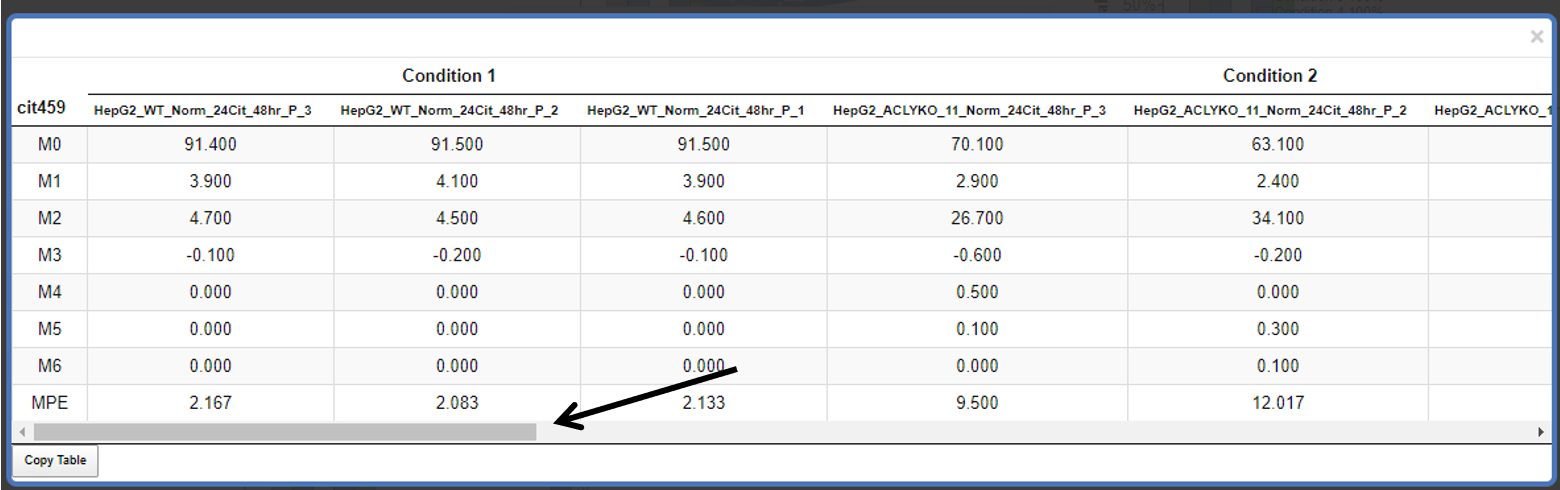
Scroll through the data using the bar at the bottom of the table:
Copy the Table:
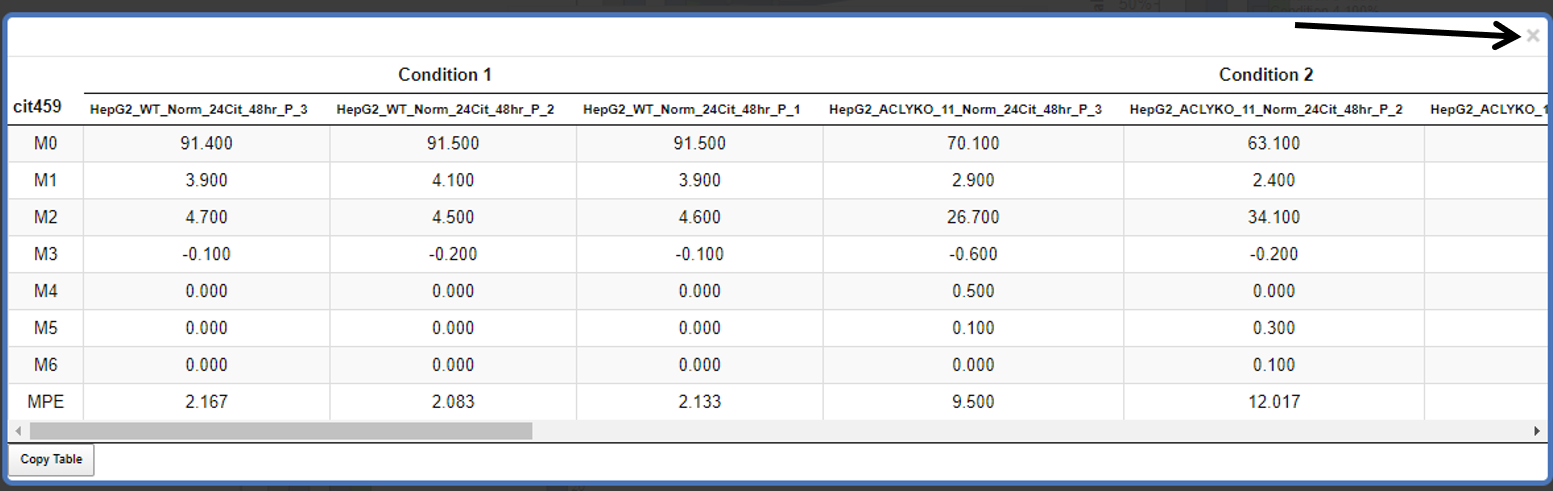
Close the Table:
2.7 Changing Graph Title or Y-axis Label
To edit the graph title or y-axis label of a graph, first: hover over the text and it will turn red, then left click.
Before Hover:
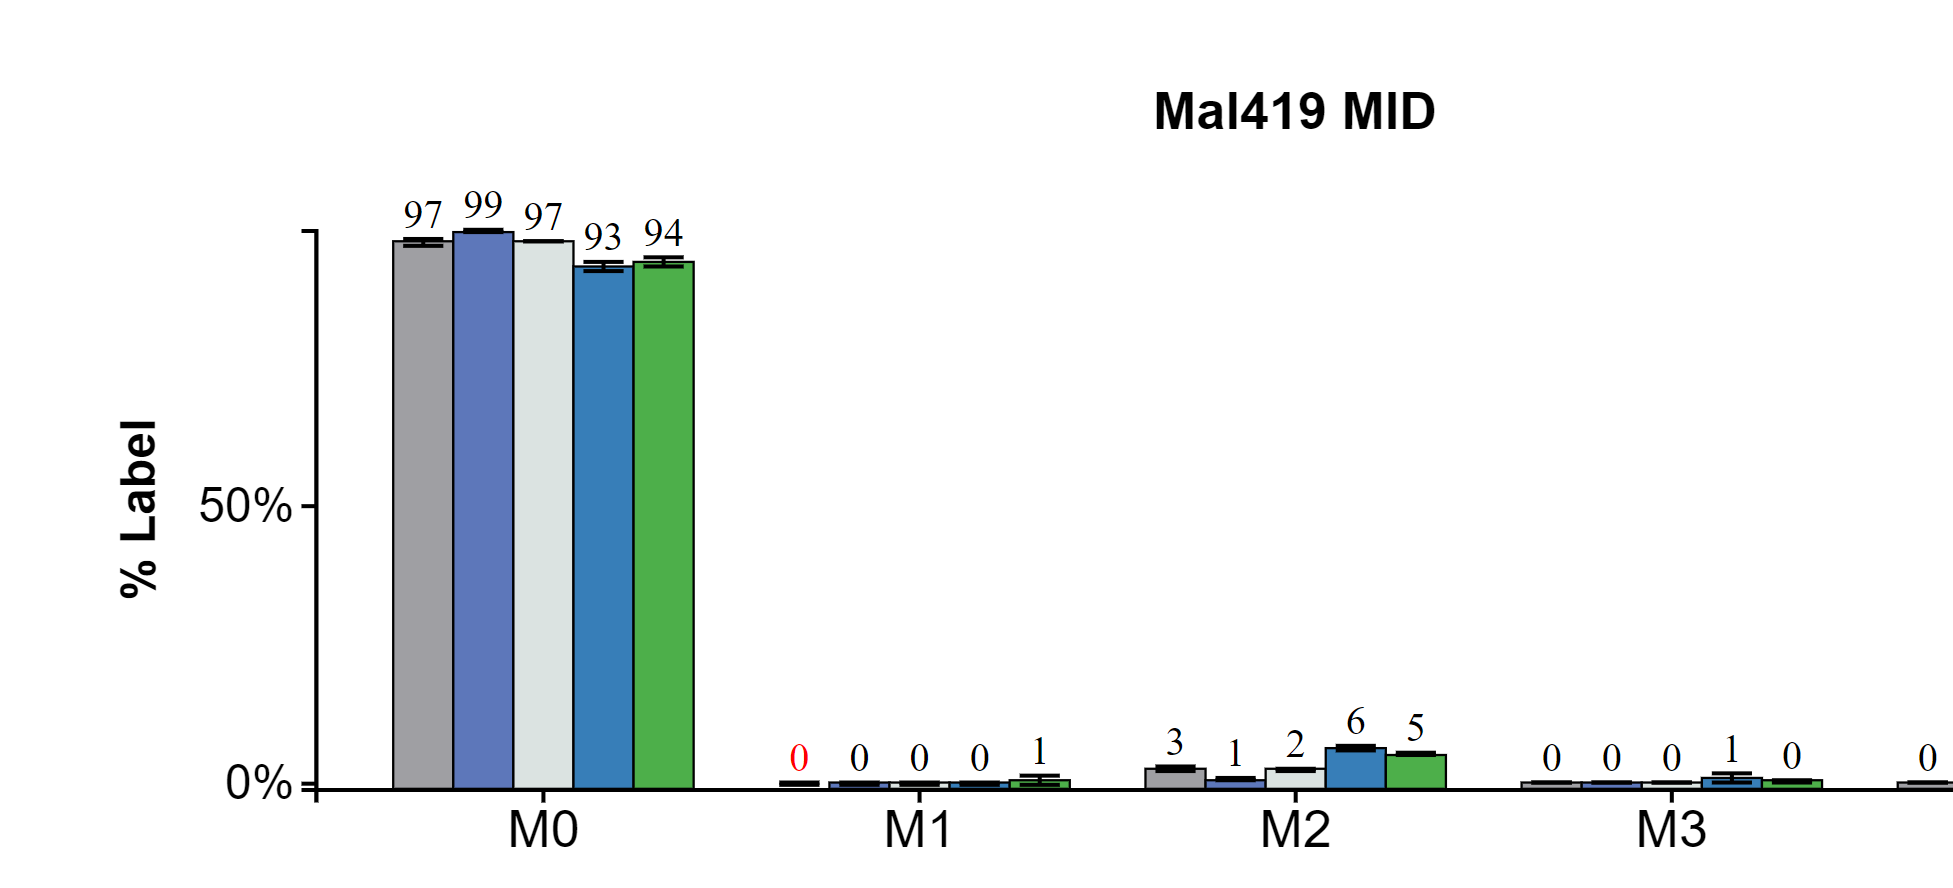
After Hover:
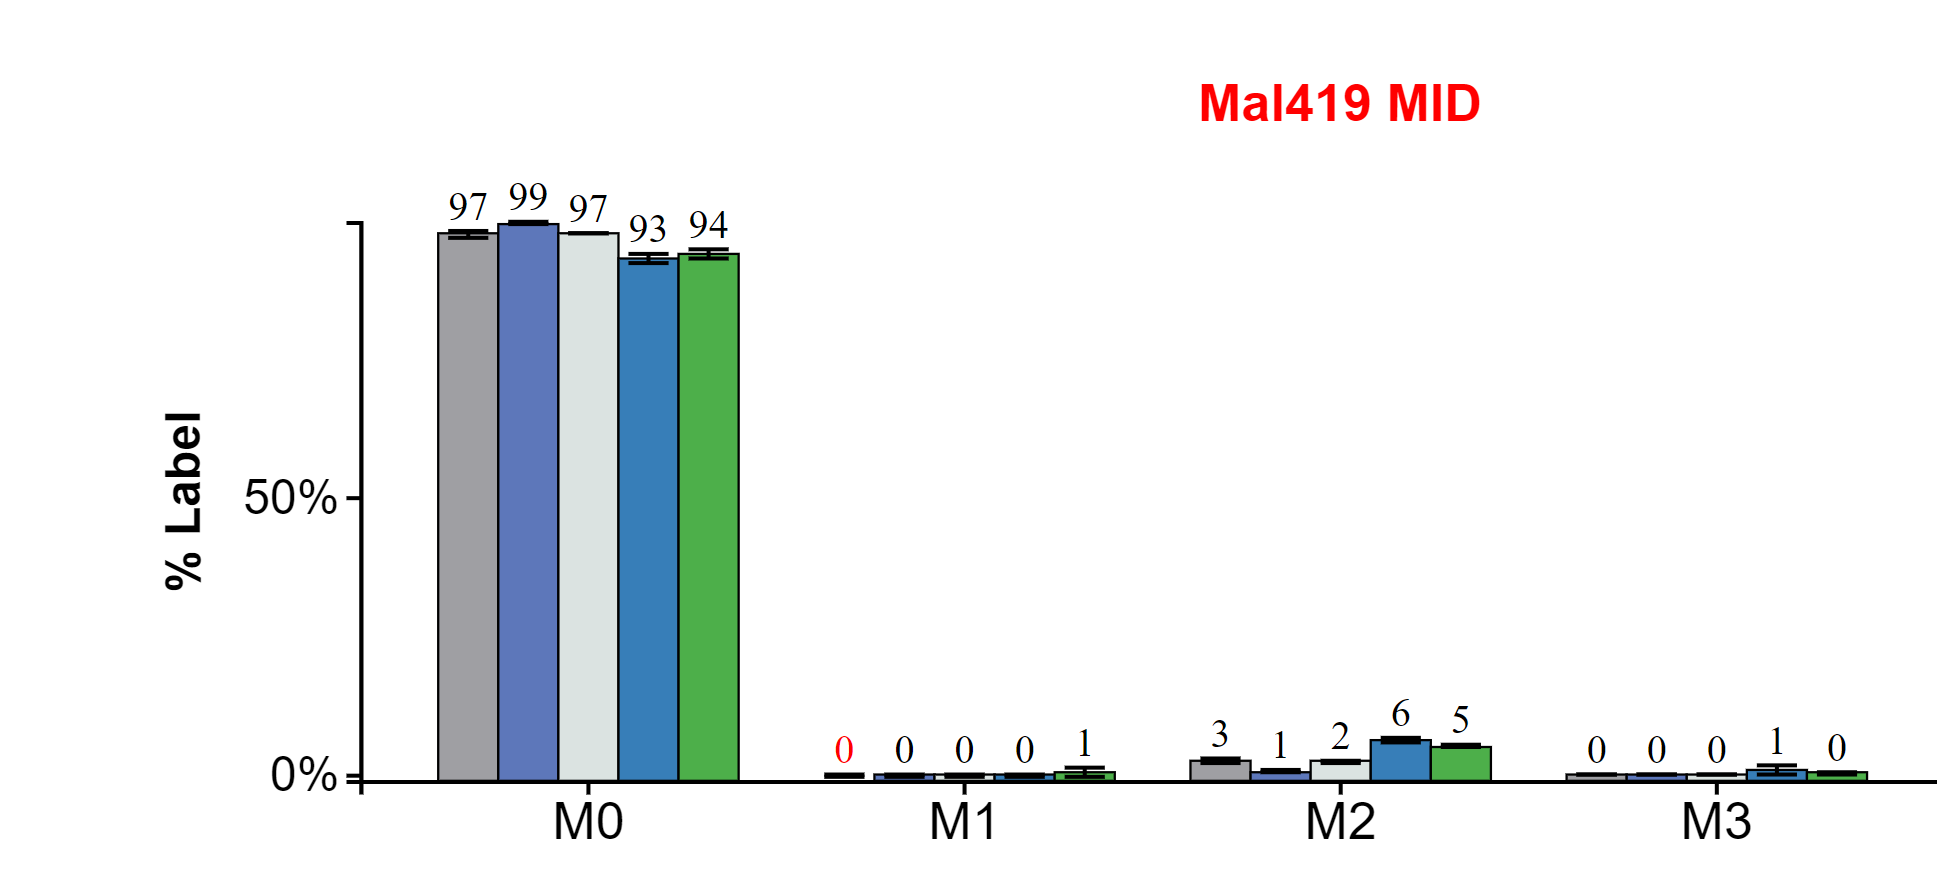
After Click:
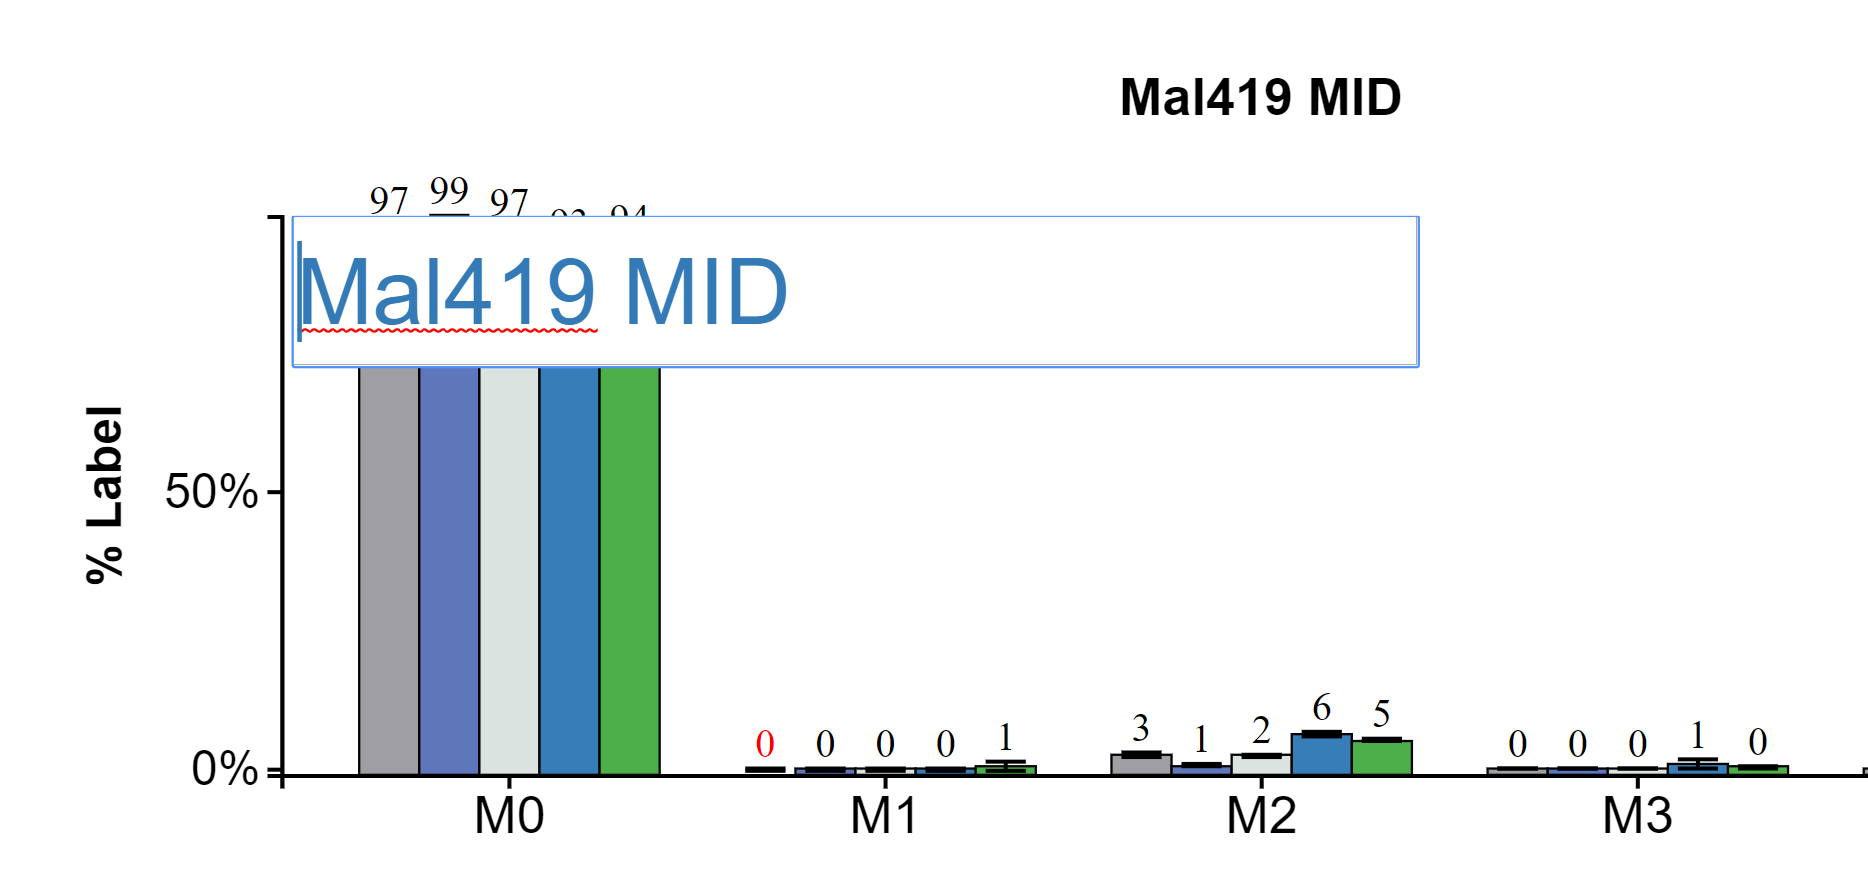
Change the text in the text input. Move through the text input with arrow keys and delete with backspace. When the desired name is entered press enter.
2.8 Generating Graphs for Individual Isotopologues
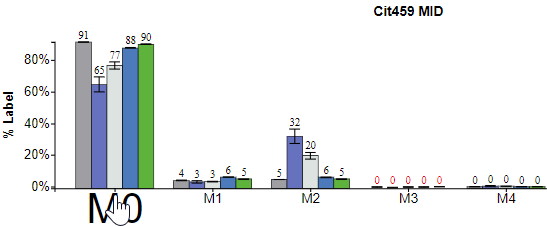
There are two methods to generate graphs of specific isotopologues (e.g M0, M1, etc.)
Method 1: Click on the desired isotopologue on the x-axis, for M0 click M0.
NOTE: This option is only available for MID graphs.
When Hovering:
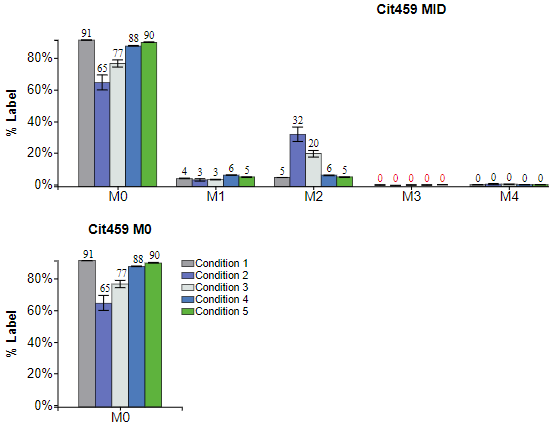
Method 2: Access individual isotopologues from the context menu of any Escher-Trace graph.
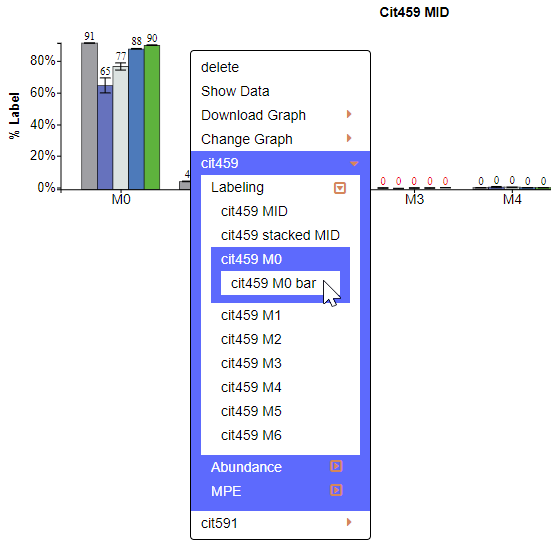
After Click:
2.9 Moving the Graphs
To move the graphs simple hover over the graph click and hold then drag to desired location.